Introduction
In-Play Scanner
Strategies
Alerts
Account
Glossary
In-Play Scanner
Scanner Tooltips
Last updated
Almost every cell in the scanner hides a full analysis card. Hover a value and the scanner shows you the story behind the number — event timelines, odds movement, market flow, head-to-head history — without ever leaving the dashboard.
How tooltips work: hover your cursor over a supported column and the card appears automatically.

Here is what each tooltip shows — and, more importantly, what to look for in it.
Available tooltips
- Match — the match center
-
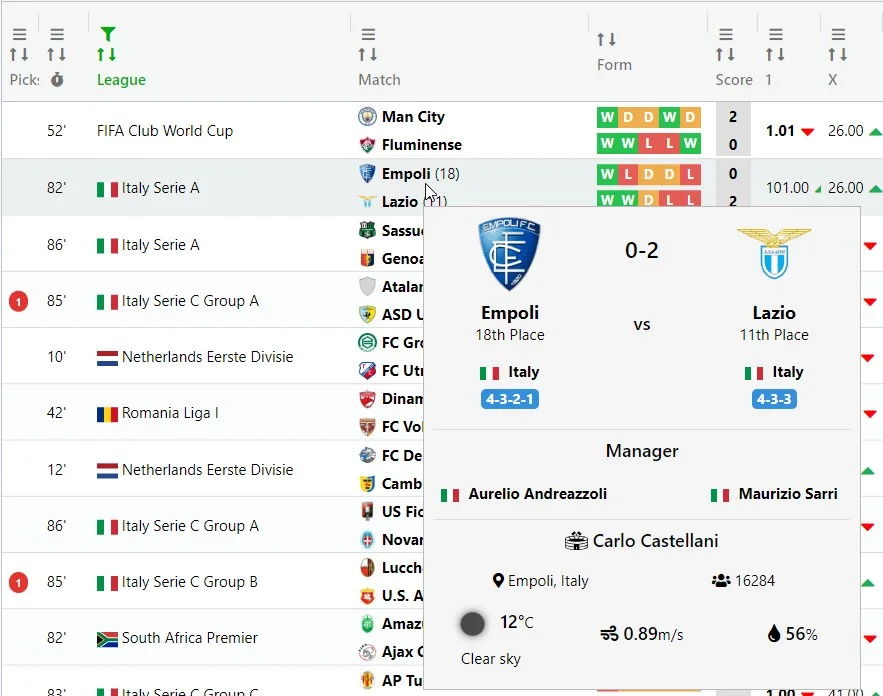
Everything about the fixture in one card: the current game state read in plain
language (is the favorite cruising, chasing, or holding on?), rest days for each
team with their previous result, league stakes (who is fighting for promotion,
Europe, or survival), formations, stadium and weather, kickoff time and managers.
What to look for: a favorite trailing on short rest, or a team with everything to play for — motivation and fatigue explain many second halves.
- Score & stat columns — event timelines
-
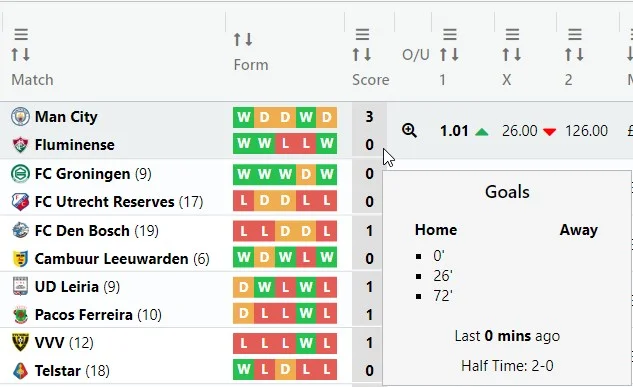
The score, corners, shots, cards and other stat columns open a vertical timeline
of every event with its exact minute: running score, half-time marker, red cards and substitutions.
Events that happened close together cluster visually; long droughts show as gaps —
so one glance tells you whether a stat has been building steadily or arrived in a single burst.
What to look for: bursts of events after a red card or substitution — that's a match changing character in real time.
- Form — history and head-to-head
-
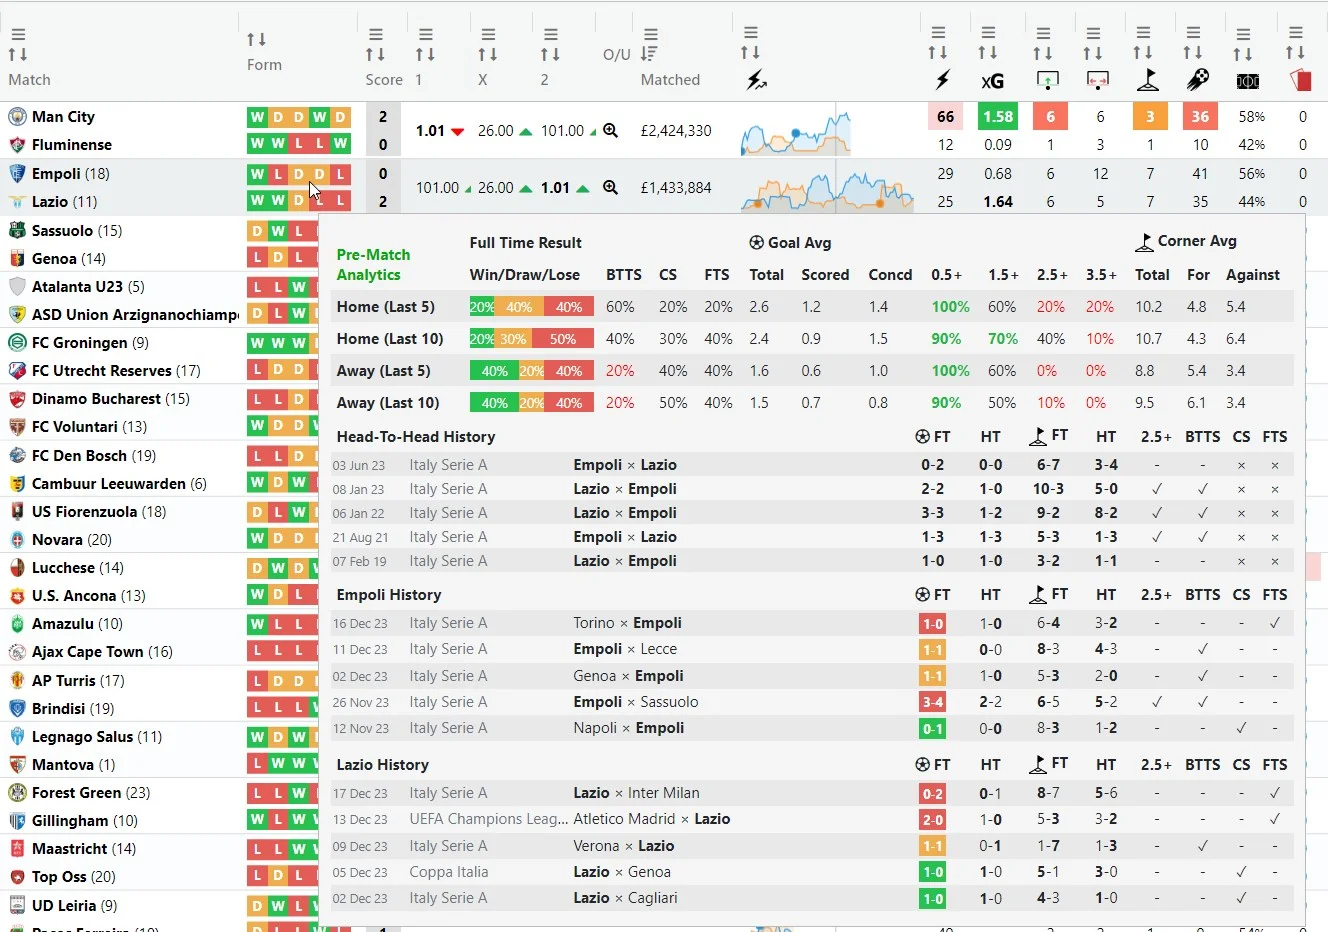
Recent results for both teams, direct head-to-head meetings, and last-5 / last-10 analytics:
win rates, over rates, both-teams-to-score and clean-sheet percentages.
What to look for: teams whose recent matches consistently go over — or head-to-heads that always produce goals.
- 1 X 2 — odds movement & market shift
-
A chart of implied probability (100 / odds) for home, draw and away since kickoff,
with goal markers so you can see exactly how each goal repriced the match.
Below it, live odds and kickoff odds side by side — the current market leader is outlined in green,
and a "Shift" strip summarises how probabilities moved over the last ~10 minutes.
What to look for: the market repricing before a goal — steady drift toward one side often reflects pressure the scoreboard hasn't caught up with.

- O / U — the goals ladder
-
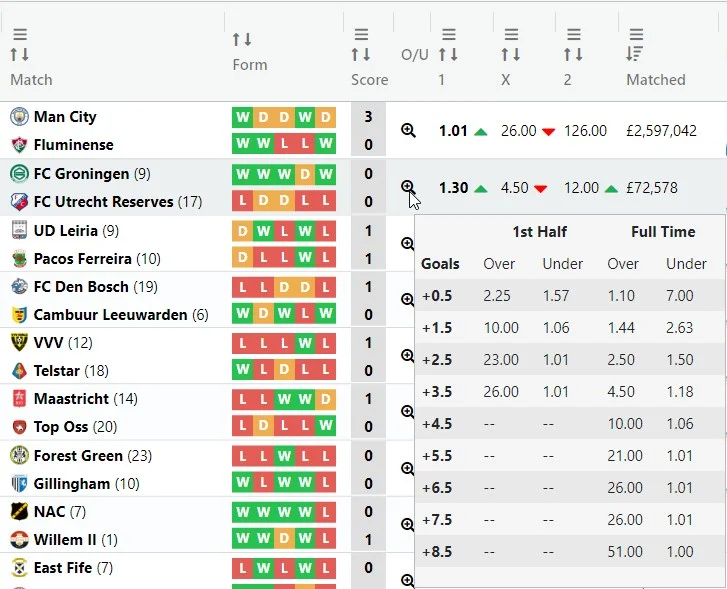
Every Over/Under line in one ladder: odds for both sides plus an implied-probability
"tug-of-war" bar per line. The main line (closest to even) is highlighted, and the card
translates the whole ladder into one number: how many more goals the market expects.
First-half lines appear before the break, and teams' second-half goal profiles add context late on.
What to look for: market expectancy that disagrees with what you're seeing in momentum and shots — that's where opinions become opportunities.
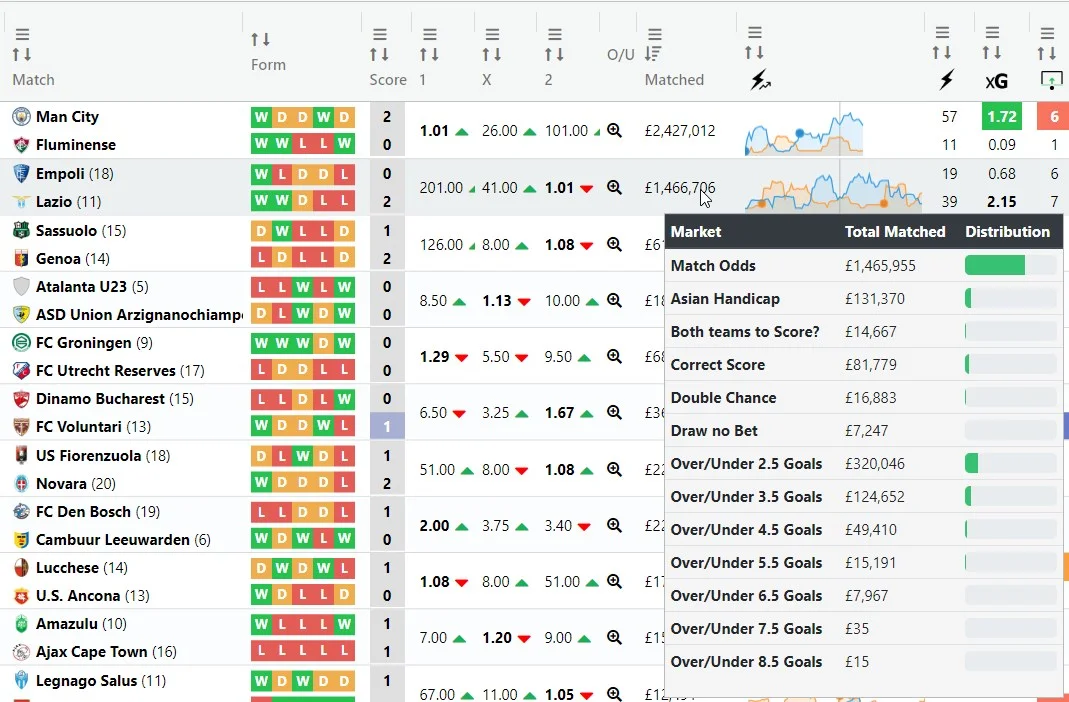
- Matched — exchange volume & flow
-
How much is matched on the BF exchange, market by market — match odds,
goal lines, corners — with share bars showing where the liquidity concentrates.
The scanner tracks volumes continuously in the background, so the card can show
flow (£ per minute) for the match overall and per market:
green when volume is coming in, red when totals are revised down.
What to look for: a sudden burst into one specific goal line — the market voting with its wallet.
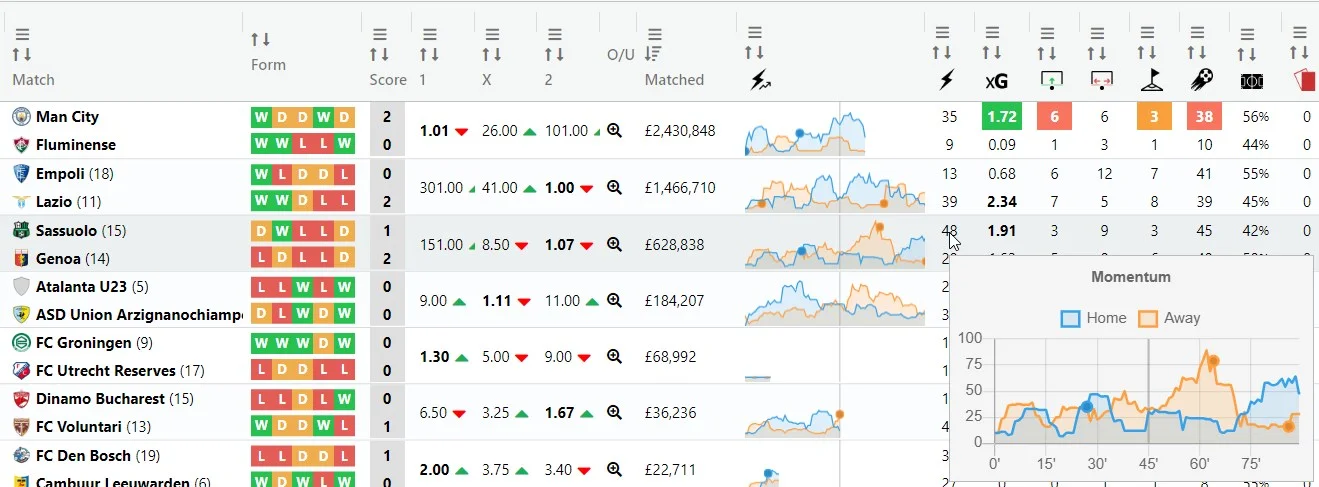
- Momentum — the pressure chart
-
A full-size chart of attacking pressure for both teams across the match, with goal markers
and a plain-language insight line (for example, "trailing, but 71% of momentum in the
last 10 minutes"). The same signal drives the pink highlight on the momentum cell —
a highlighted cell means this insight line is waiting in its tooltip.
- xG — finishing quality
-
xG against actual goals for each team, with a verdict chip: a team scoring well
under its xG is due; one scoring above it is being clinical — or lucky.
What to look for: a dominant team sitting 1.4 goals under its xG — pressure that hasn't paid off yet often does. - Picks — your strategies' verdict
- Which of your strategies picked this match, each strategy's historical strike rate, what has happened since the pick (goals, corners), and whether several strategies converged on the same match within minutes of each other — the strongest signal the platform can give you.
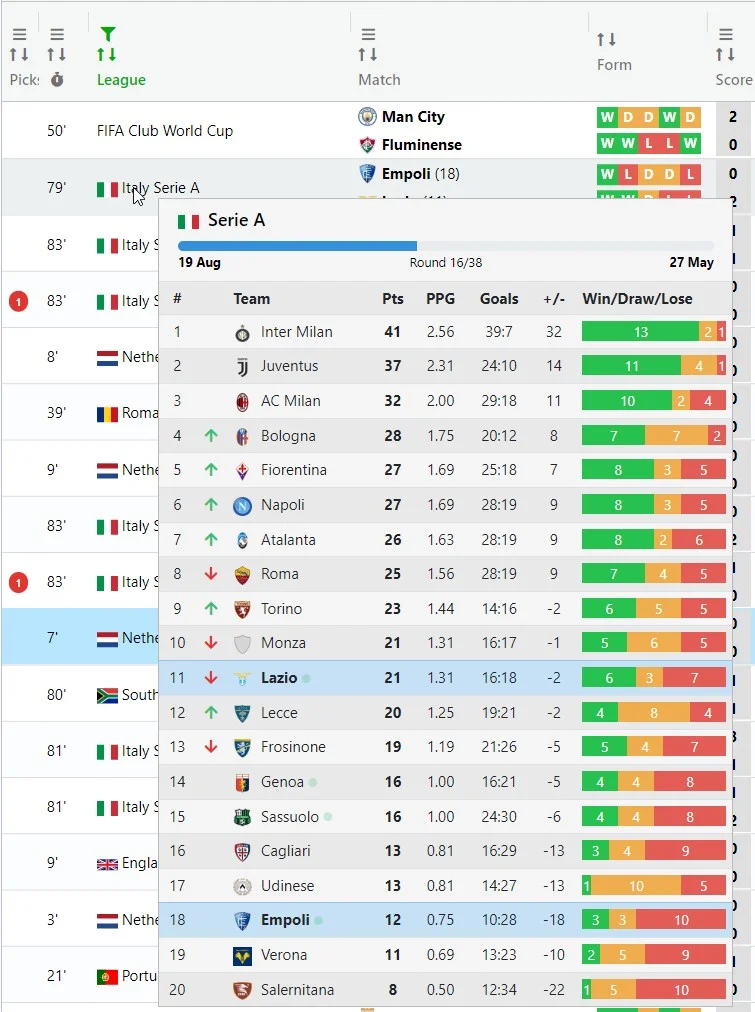
- League — standings in context
-
Full league table with promotion and relegation zones color-coded, season progress,
win/draw/loss bars and goal differences. The two teams currently playing are highlighted.
Tip: the tooltips are designed to answer the question a number raises the moment it raises it.
See 8 corners? Hover: were they spread across the match or five in the last ten minutes?
The same number means two very different matches.