Introduction
In-Play Scanner
Strategies
Alerts
Account
Glossary
In-Play Scanner
Live Dashboard Structure
The InPlayGuru in-play football (soccer) scanner is the core of the platform. It brings live match updates and key pre-match context into a single, interactive dashboard designed for speed, clarity, and control.
Live football generates a huge amount of data. To keep the scanner readable, only the most important information is shown by default. You can then add, remove, reorder, and filter columns to match exactly how you analyse matches.
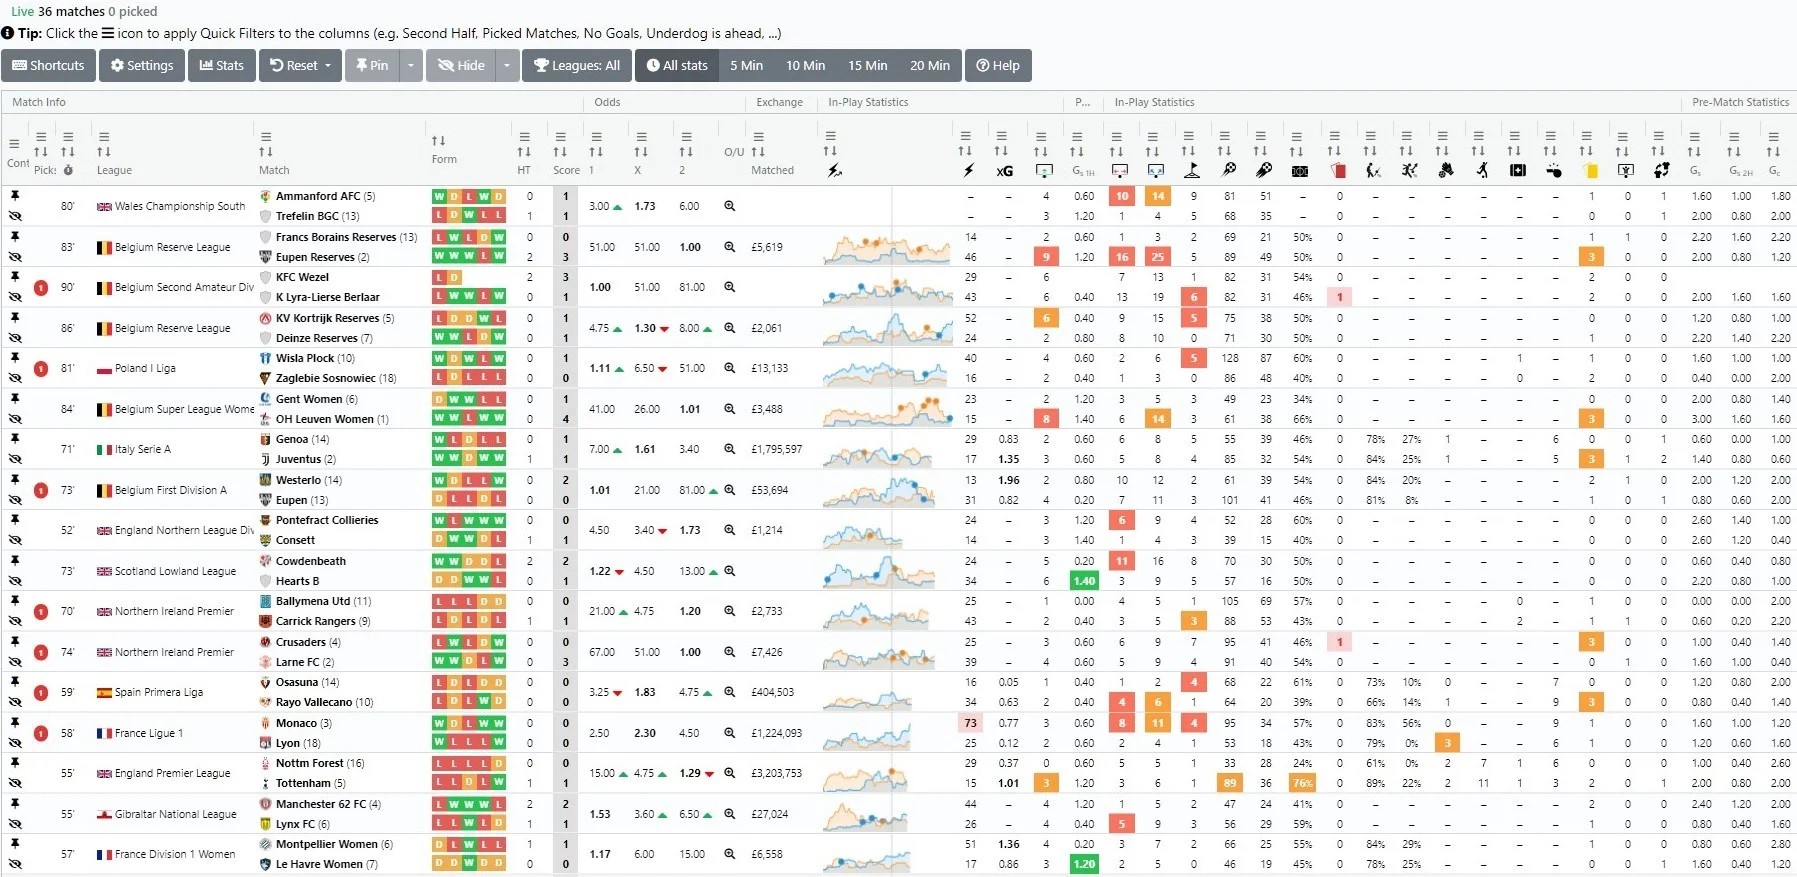
How the scanner is organised
If you’ve ever worked with spreadsheets, the scanner will feel familiar. It follows the same clear structure, making it easy to compare matches and spot patterns quickly.
Columns
Each column represents a specific metric or data point (for example goals, momentum, shots, or xG). Columns can be rearranged, hidden, or sorted to prioritise what matters most to you.
Each column represents a specific metric or data point (for example goals, momentum, shots, or xG). Columns can be rearranged, hidden, or sorted to prioritise what matters most to you.
Rows
Each row represents a single live match. All relevant data for that match is displayed horizontally, allowing fast comparison across multiple games.
Each row represents a single live match. All relevant data for that match is displayed horizontally, allowing fast comparison across multiple games.
This structure makes it easy to:
- Compare multiple live matches at a glance
- Sort games by key statistics or match state
- Focus on a smaller set of matches using filters and pinning
Mobile note: the scanner is optimised for desktop and larger screens.
When you’re away from your computer, alerts and notifications help you stay informed
without needing the full dashboard open.